THE END OF AMERICAN EXCEPTIONALISM
The end of the beginning
The prevalent investment trend over the past twenty-odd years: has been a significant overweight in American equities across various global investment portfolios, particularly from UK pension funds, European private banks, and Asian wealth managers.
This trend has been driven by the stellar performance of U.S. markets, particularly in the technology sector, contributing to a default preference for U.S. equities in global asset allocation.
Despite the global preference for U.S. equities, recent developments have prompted investors to reassess their investment allocation, sparking the question: is this the end of American exceptionalism?
Shifting Grounds
In the context of escalating trade tensions, particularly between the United States and China, the traditional mechanisms of financing the U.S. current account deficit are undergoing significant shifts. Historically, countries with substantial trade surpluses, such as China, have recycled their dollar earnings into U.S. assets, notably Treasury securities. This practice has played a pivotal role in financing the U.S. current account deficit, which reflects the combined balances on trade in goods and services and income flows between U.S. residents and residents of other countries.
In 2024, the U.S. current account deficit widened by $228.2 billion, or 25.2%, reaching a record $1.13 trillion, representing 3.9% of GDP—the highest since 2022 (Bureau of Economic Analysis, 2025). This expansion underscores the nation's increasing reliance on foreign capital to finance its consumption and investment activities. The U.S. deficit's growth is primarily driven by an expanded deficit on goods and a shift in primary income from a surplus in 2023 to a deficit in 2024 (Reuters).
Washington's Mixed Messages
The evolving narrative from Washington—characterised by aggressive tariff policies and mixed signals on fiscal openness—is increasingly being interpreted by global capital allocators as unwelcoming. The implicit message, as some have summarised, appears to be: “Sell our currency and go away.” While a mass exodus from dollar assets hasn’t yet occurred, signs of strain are clearly emerging.
China’s Strategic Pullback from U.S. Treasuries
China has long been among the largest foreign holders of U.S. Treasury securities. As of February 2025, China’s holdings stood at approximately $784.3 billion, up modestly from $760.8 billion in January (U.S. Department of the Treasury, 2025). However, this is well below the peak of over $1.3 trillion in November 2013 (CEIC Data, 2025), reflecting a multi-year effort by China to diversify its $3.24 trillion in foreign exchange reserves. At the beginning of the year, we highlighted the possibility of a gradual shift away from U.S. dollar assets toward gold, bitcoin, and Chinese yuan.
The 145% tariffs on select Chinese goods represent a substantial escalation in trade policy, effectively functioning as a tax on imports. For comparison, a 10% tariff adds $1 to the cost of a $10 product, increasing its total to $11. However, a 145% tariff inflates the same product’s cost to $24.50. These sharp increases threaten to dampen trade volumes, add inflationary pressures, and distort global supply chains.
Capital Retaliation?
As these tariffs reverberate through global markets, countries impacted may reassess their investment strategies, including reducing exposure to U.S. financial assets. Speculation persists that China could further cut its Treasury holdings in retaliation (The Times, 2025). Meanwhile, central banks globally are rebalancing away from the dollar: the greenback’s share of global foreign exchange reserves fell from over 70% in 2000 to just 58.4% in 2024, as allocations shift toward the euro, yuan, and gold (IMF COFER, 2024).
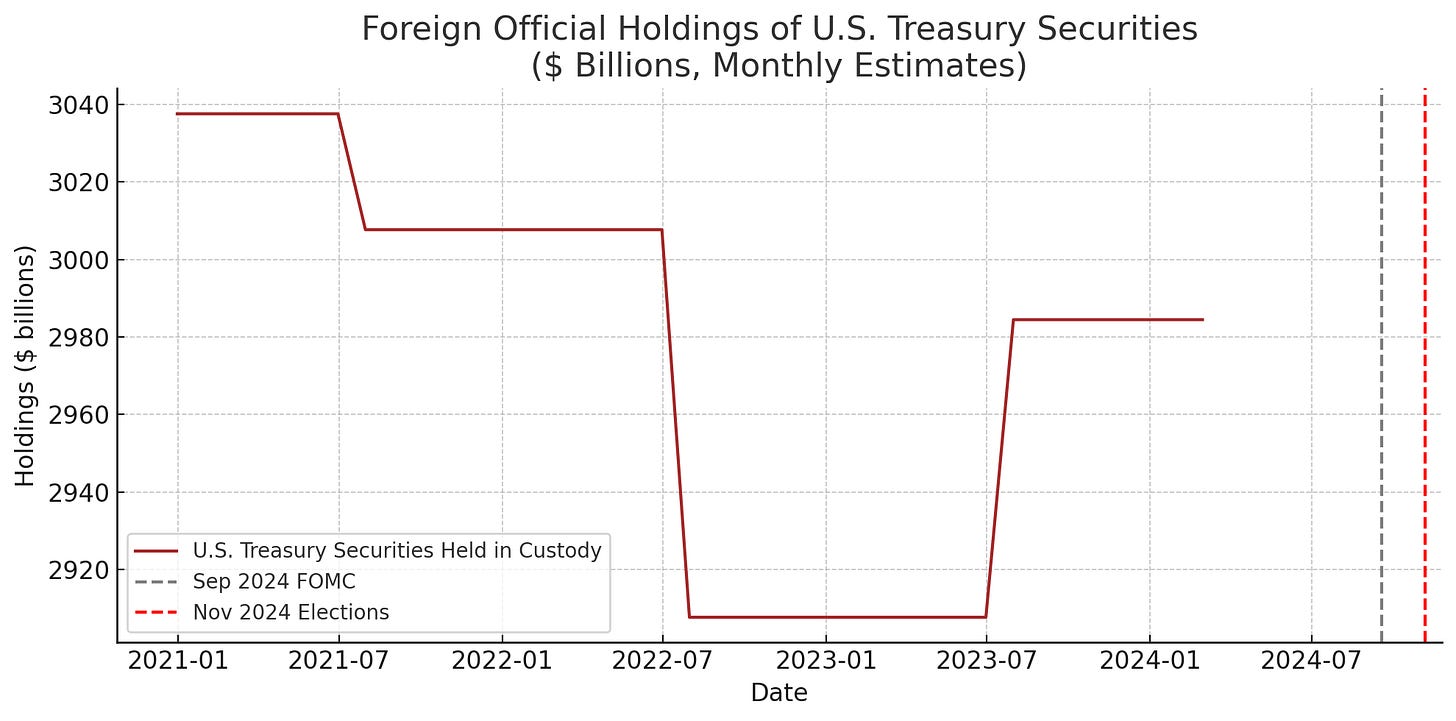
The chart below displays the monthly average of foreign official dollar reserves custodied at the Federal Reserve. Dollar reserves are the sum of foreign official holdings of U.S. Treasuries and reverse repos via the foreign repo pool. Holdings peaked around 2020 with over $3.03 trillion and gradually declined to approximately $2.92 trillion by February 2024. This nearly $120 billion drop (−3.9%) suggests a strategic pullback by foreign governments, potentially reflecting concerns over U.S. fiscal policy, rising interest rates, or geopolitical tensions (U.S. Treasury, 2024).
Source: U.S. Treasury. (2024). Treasury International Capital System – Table 3.13.
The structural changes underway in global capital flows are not cyclical—they are secular and strategic. As such, the best approach for investors is to remain deeply informed, agile in execution, and guided by rigorous, research-driven updates. Subscribe and stay tuned to Global Market Dynamics (GMD) publication for timely data analysis, geopolitical assessments, and forward-looking insights—because understanding the capital flows of today is key to identifying the opportunities of tomorrow
.


